Alert system details
So…. I designed my own query and templating languages (along with associated editors and complete with syntax highlighting). It was definitely overkill, but it was fun and now I can define alerts any way I like: easy ones, complicated ones, whatever alerts I want. With integrated documentation and helper functions to assist with defining your queries. As I’m sure you can imagine, this post expands on TWIG Irrigation alerts.
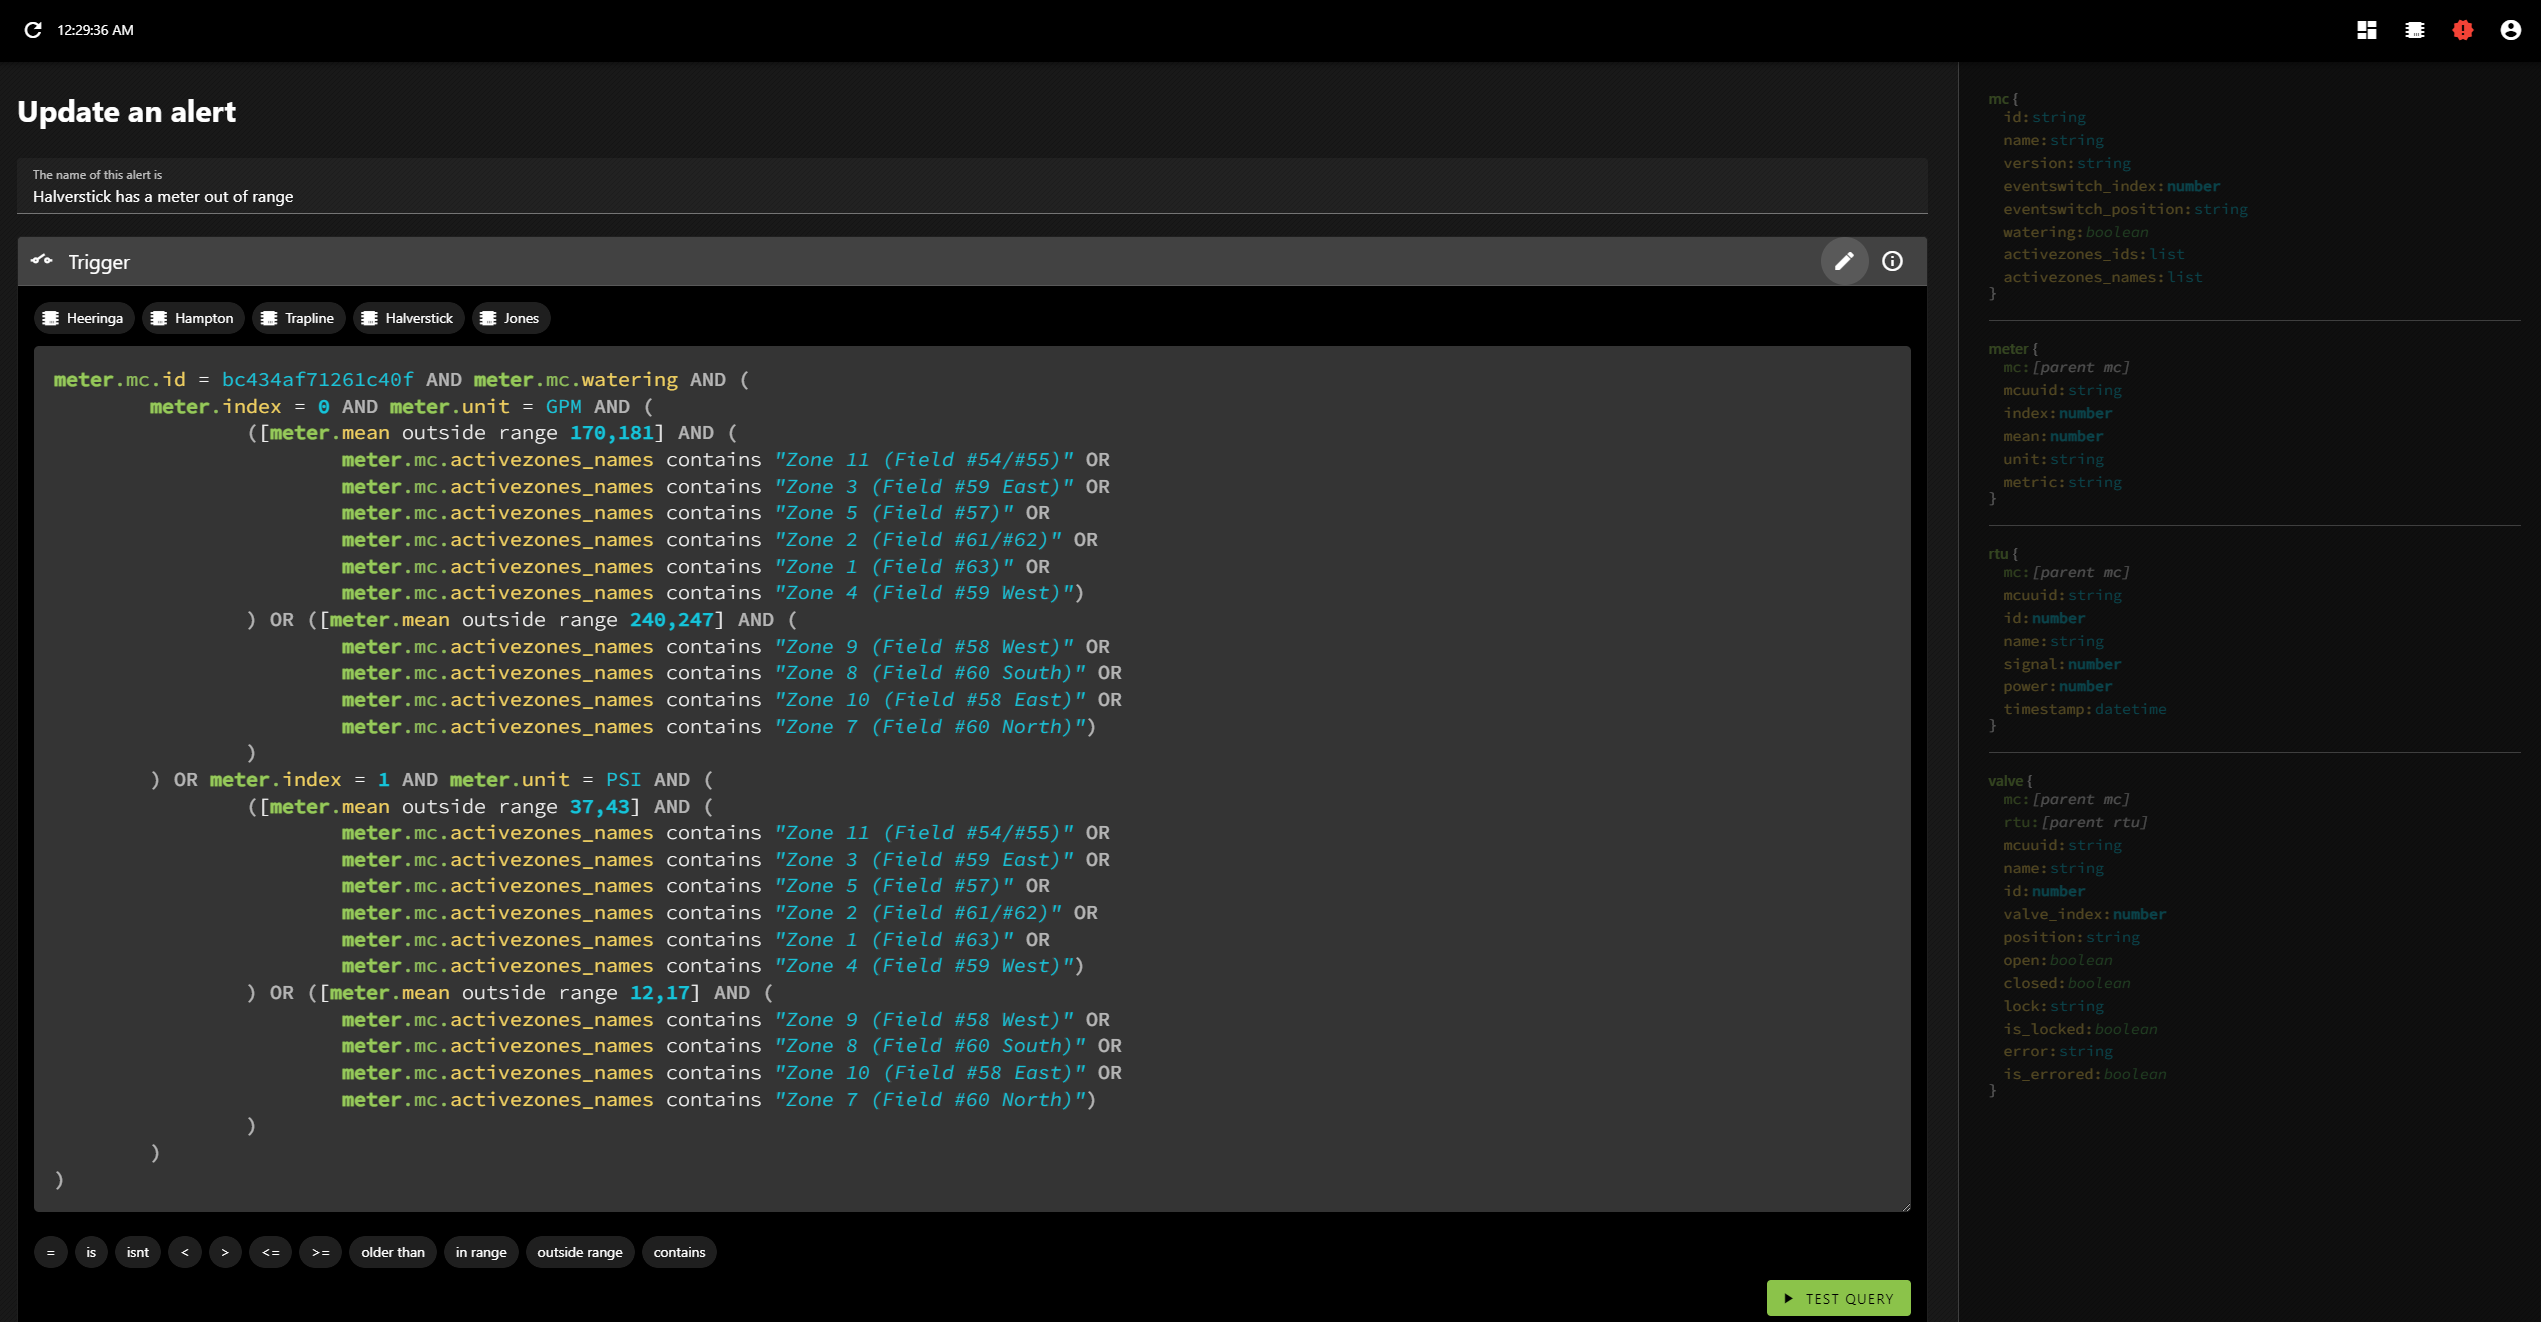
Let’s take a look at the interface with an example query:

The cursor (which you can’t see) is at the end of the line—right after rtu.mc. On the right, there is a description of the available data objects. RTU is opaque (but its properties are not, though you can see its mc property is highlighted). The editor detects where you are and organizes the objects on the right, highlighting the relevant information. It’s why the entirety of MC is opaque. So if you want to deal with a field particular to an MC, you know what they are and their datatypes. You can either type it in, or click on the field there and it will insert itself.
You can do a lot that way—just by clicking. The buttons above the trigger code block insert the MC IDs; each one represents a farm. The buttons below the trigger block insert the various conditionals you can apply.
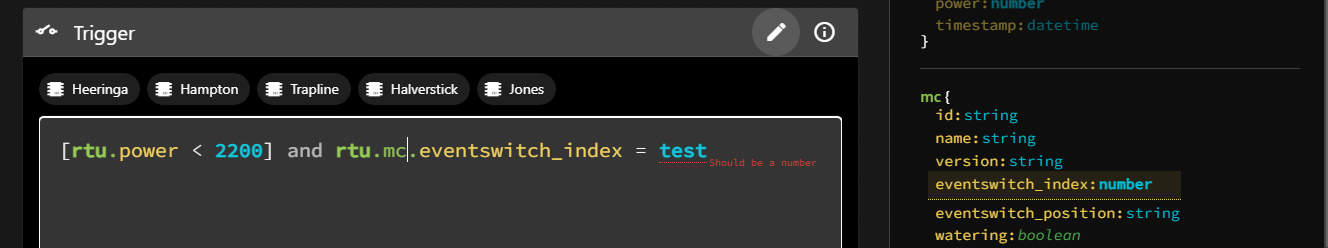
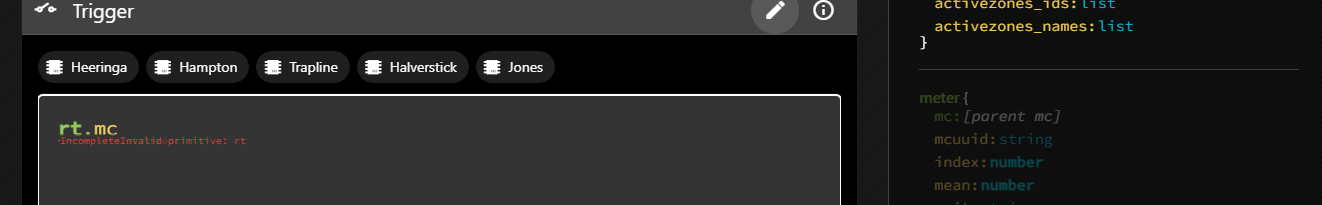
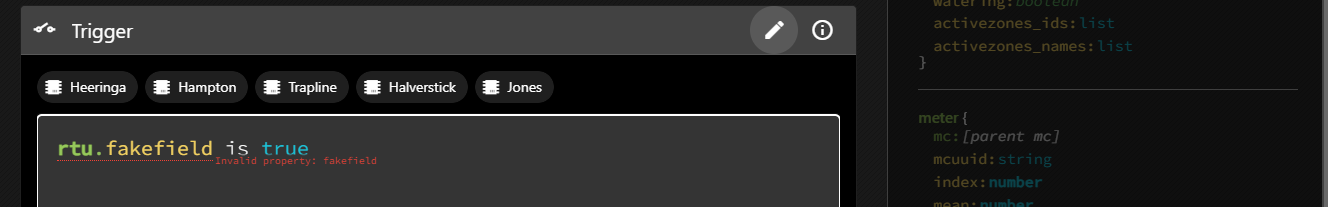
And of course there is error checking:
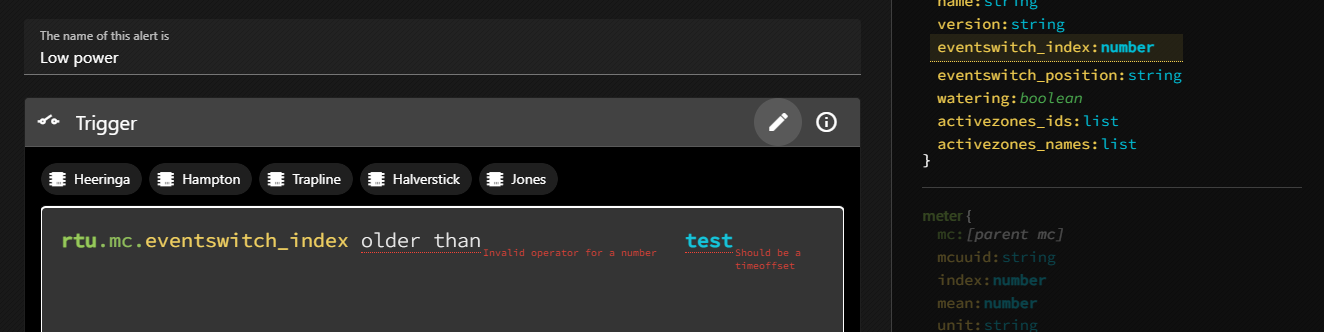
To learn about the trigger definitions in even more detail, you can click the little i in a circle which will reveal the documentation in-place.
But what about the query that got us here? [rtu.power < 2200] and rtu.mc
The first section is pretty obvious (it will return true if an RTU’s power field is less than 2200) but the rest looks a bit weird. but let’s ignore that for now and get into testing a query.
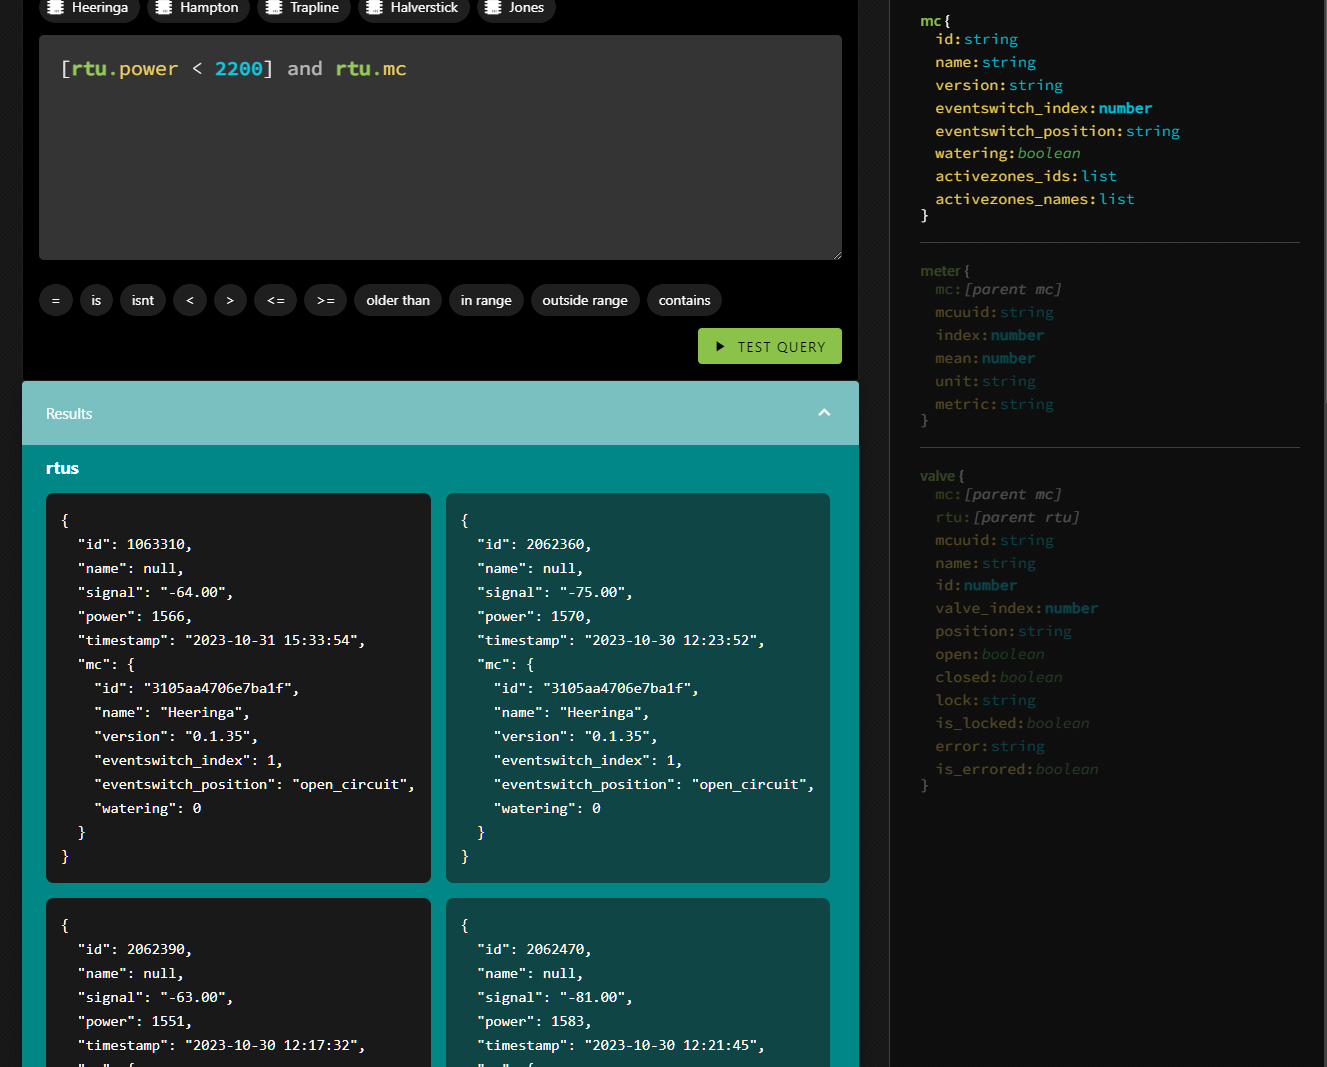
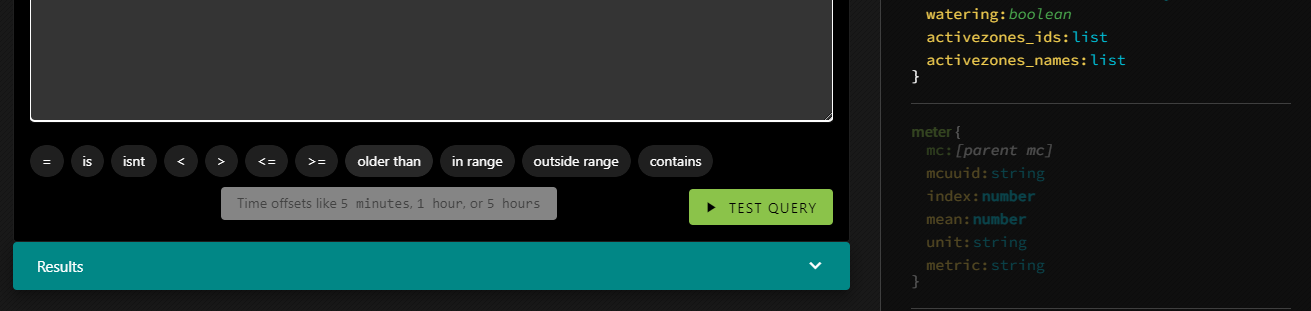
If you test a query and the query has no results it means that there is no error, and so the alert won’t be triggered yet. That’s great, but it’s not very useful when you’re working on an alert. You won’t see anything in the results tray, so you won’t have any handy examples to show you the shape of the data you’ll be able to reference in the alert itself.
That’s what the square brackets are about. [rtu.power < 2200] means that when testing the query, the system will ignore this condition. So if there are no RTUs with low power, you’ll still see results in the tray. They’ll just have power higher than 2200.
But why and rtu.mc? That has to do with enriching the results.
In the returned data, sub-primitives are only filled in as necessary, but you may find yourself in a situation where you want deeper access. If the query were simply rtu.power < 2200 you’d get back all the fields of the RTU, but the MC object wouldn’t be filled in. Which is fine, unless we want to reference one of the MC’s fields in the alert message. So an easy way to fill it in is just to include it in the query without an associated condition.
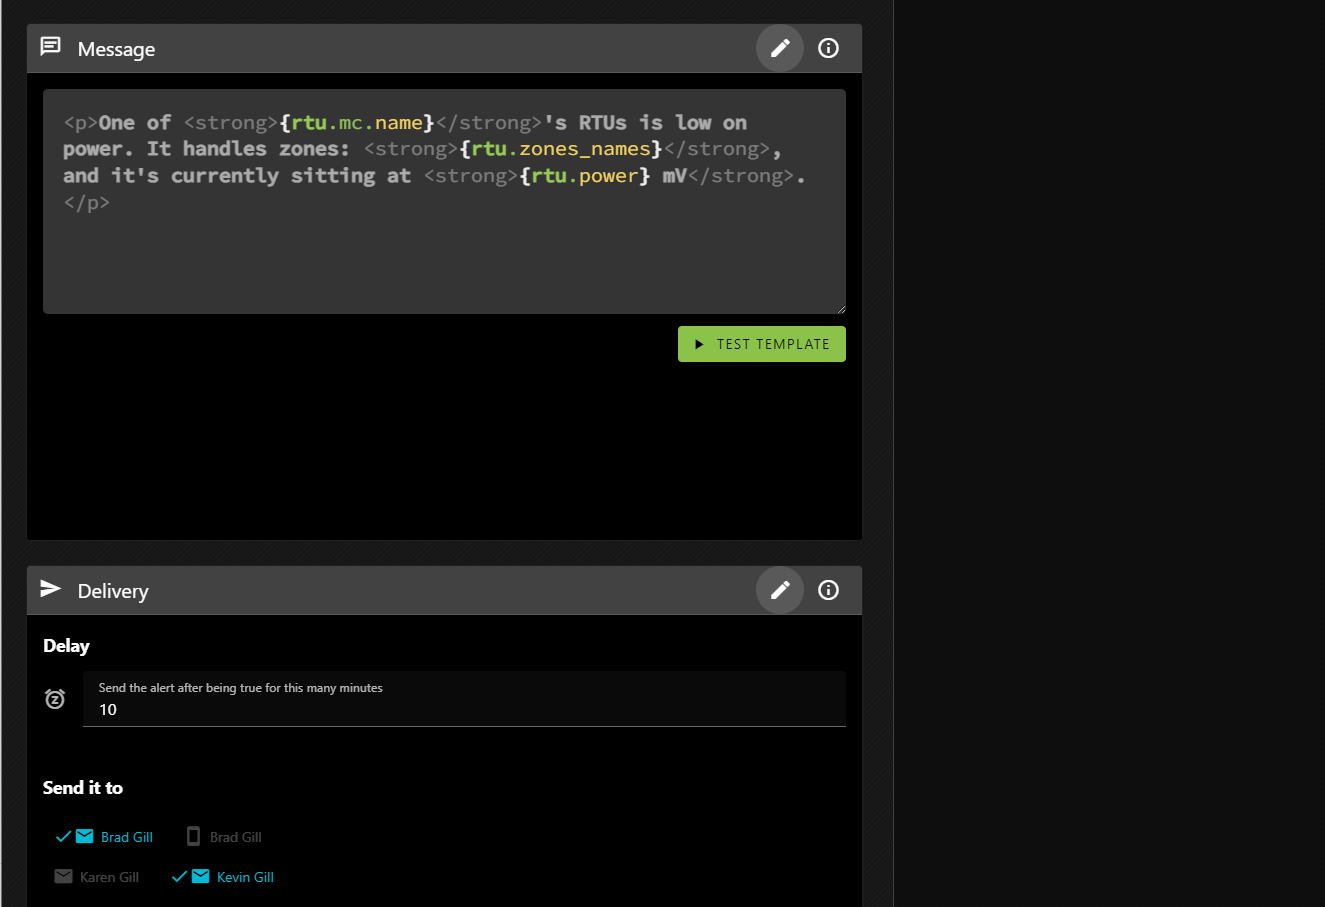
The message block is where you define what the alert will say when it is triggered. As you can see it allows HTML formatting, and you can insert values from the results. This message will be repeated, one for each result, all in a single message so you’re not bombarded with emails.
You can see that it references the MC’s name (the farm name), as well as the RTU’s power level. But it also includes a property not present in the results: rtu.zone_names.
Various primitives include helper properties (which you can learn more about by clicking on the i in the circle). rtu.zone_names returns the valve names associated with an RTU as a comma-delimited string, which can help you determine which RTU you’re looking for if you haven’t named it. In our case, the valves are often named for specific fields, but the RTUs are not.
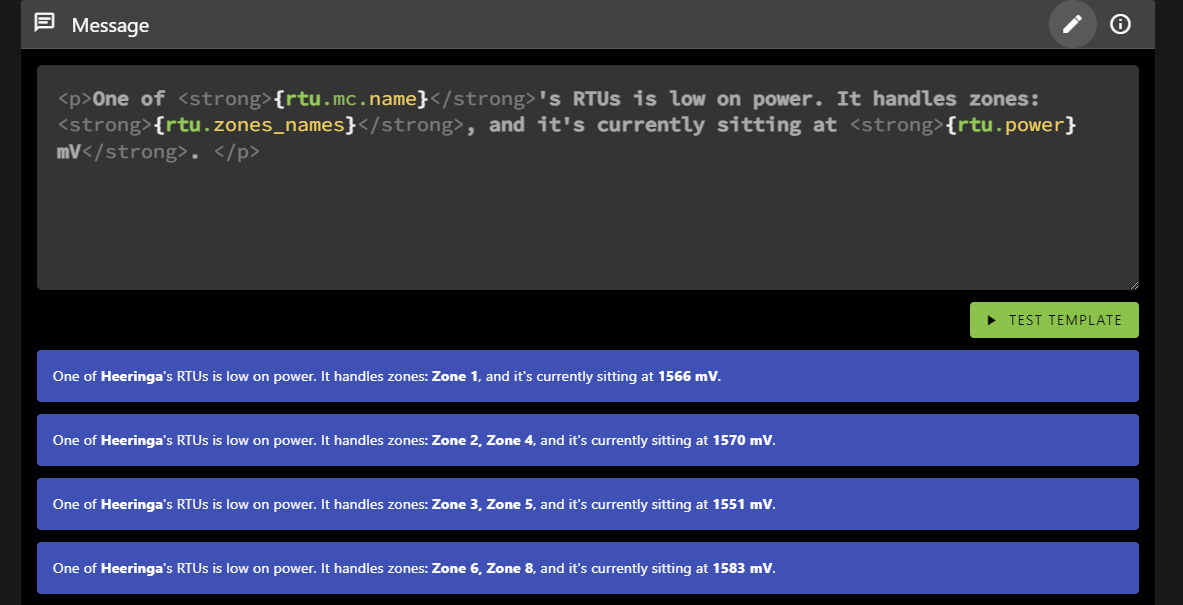
The TEST TEMPLATE button will show you how the message will be rendered based on the same results TEST QUERY would generate.
And that’s pretty much it! Except that things can get much more complicated.
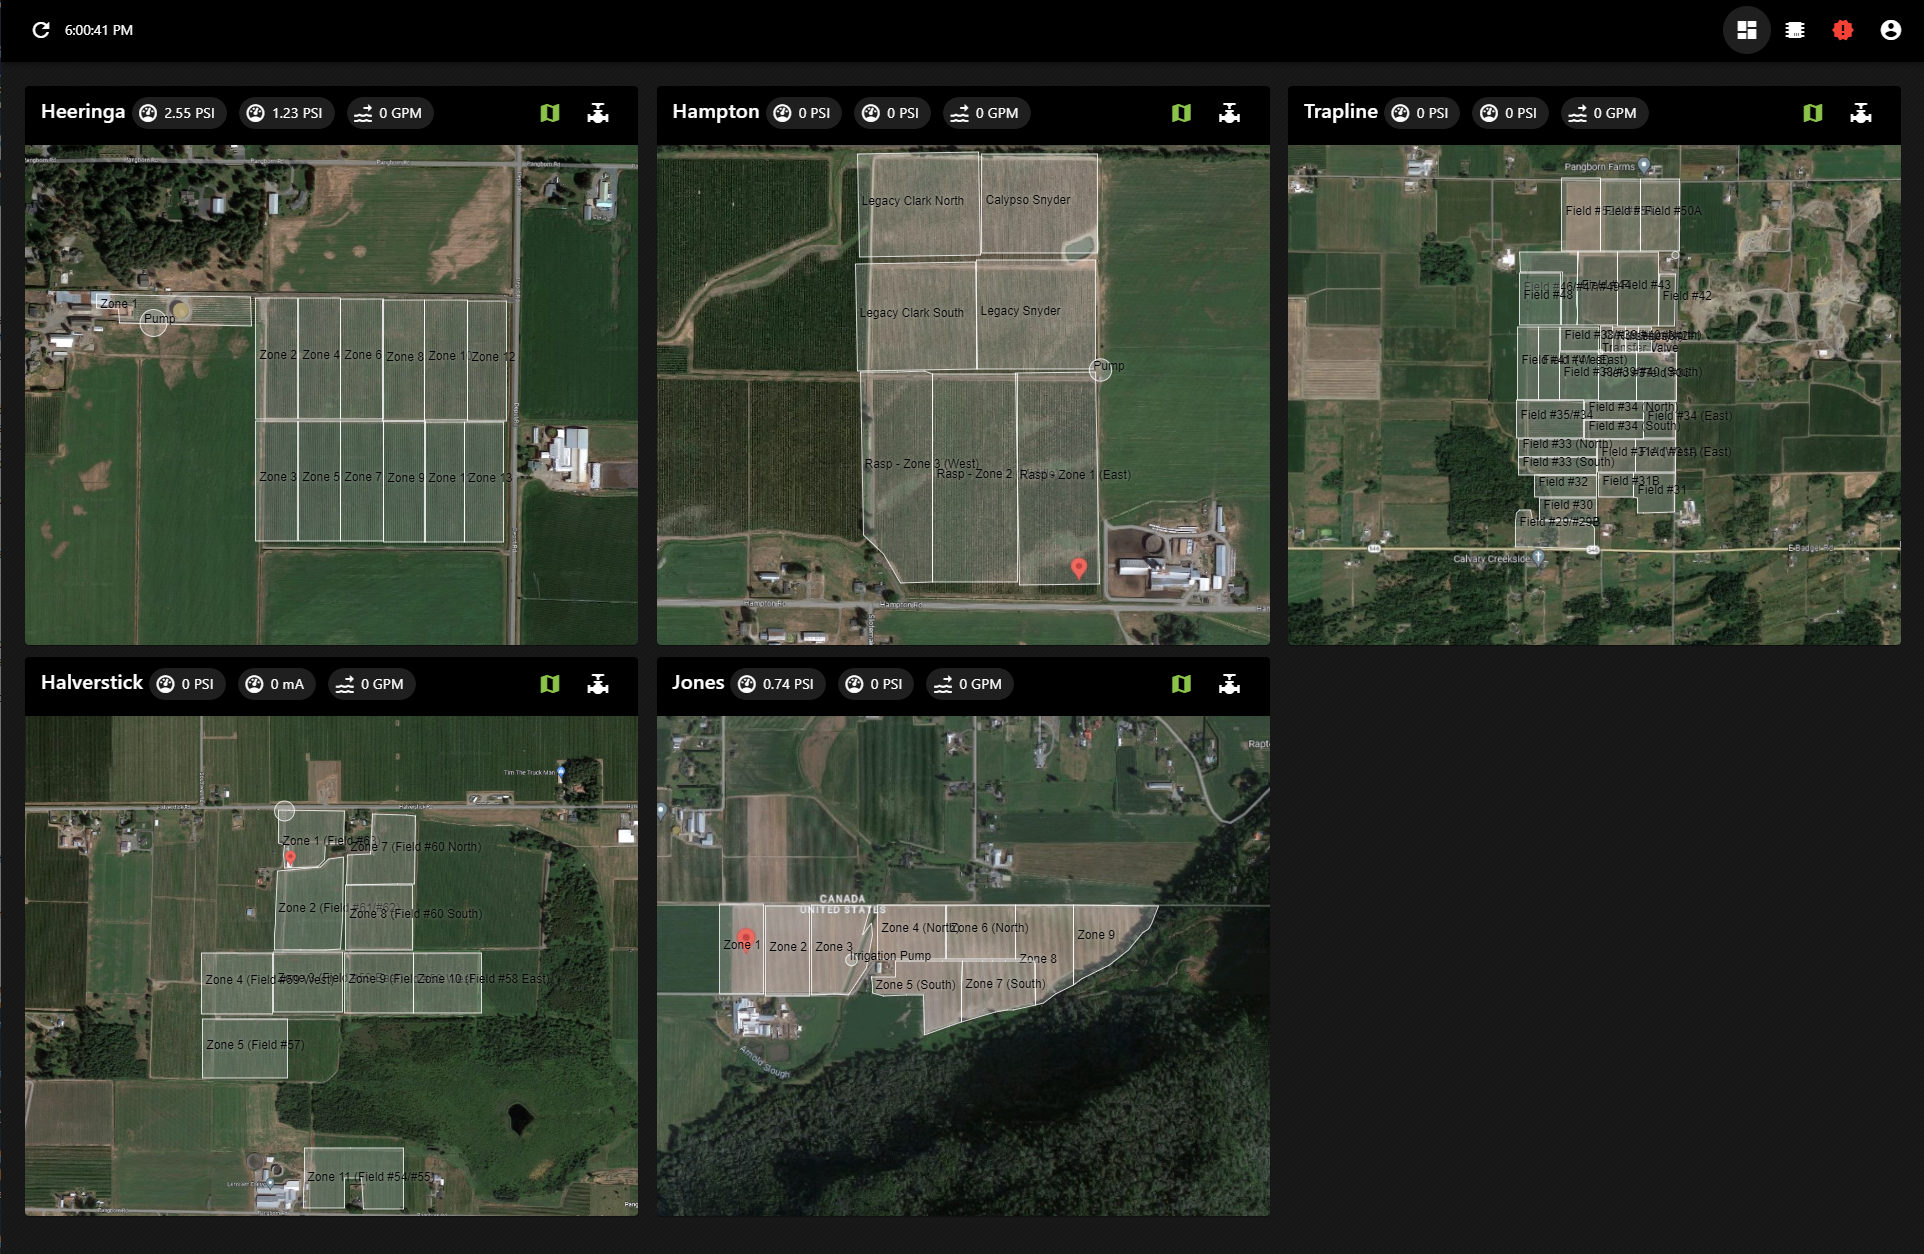
You may remember that in my previous post on the topic I mentioned that I analyzed the data and programmatically generated meter alerts for each farm? Let’s take a look at one of those!
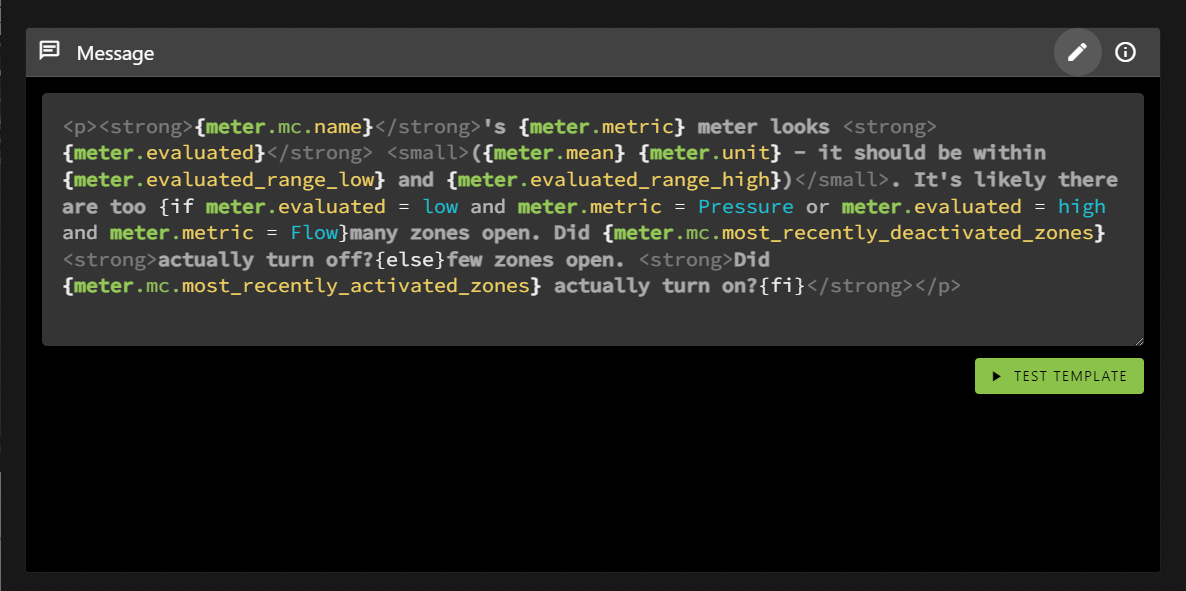
Oh, yeah, and the templating language allows conditional inclusion, where the conditions are evaluated using the same syntax as the query language.
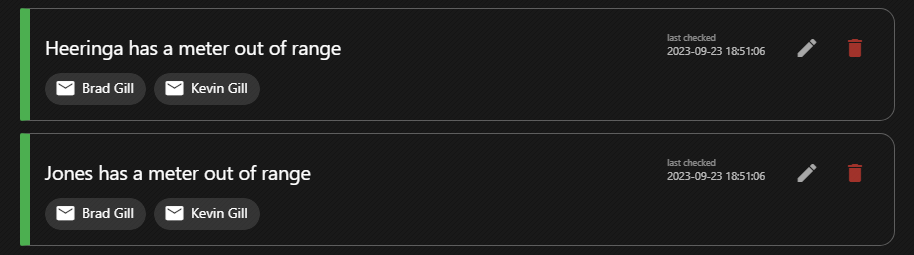
Alerts aren’t re-sent until the system detects that they’ve been corrected. This means that if things continue to go wrong you won’t know, but also means that you wont’ have a bunch of cascading messages obfuscating what was most likely the root cause (the first error). That makes sense for something like meter range errors and it’s why I did all the metres for each farm as a single alert. That way you’ll only get one metre error per farm at a time.
It doesn’t make as much sense for errors that are unrelated (like the RTU power alert), but I can address that with an alert setting when and if it becomes an issue. It’s not overly important at the moment; since it can be currently handled by defining individual alerts rather than grouping them together.